ALPHA FIBONACCI TRADING ROOM
View the Precision of Alpha Fibonacci Software and System with Multi-Market Scanners and Trade Recognition Software on Futures. Every Trade has Precise Entry, Stops and Targets. The Same Precision applies to Stocks, Crypto, Forex, Options, ETF’s and Mutual Funds. Ask questions about any instrument during quiet times. View our students performance and how they rate Fibonacci Trading Institute.
The Alpha Fibonacci Trading Room is open from Tuesday to Thursday at 9:30 EST and will remain open based on market volatility.
Please view 1000+ videos from our Trading Room and join 3000+ Subscribers on our
Fibonacci Trading Youtube Channel.
Live Trading Room: This presentation is for educational purposes only and the opinions expressed are those of the presenter only. All trades presented should be considered hypothetical and should not be expected to be replicated in a live trading account. Testimonials may not be representative of other clients and
is not a guarantee of future performance.
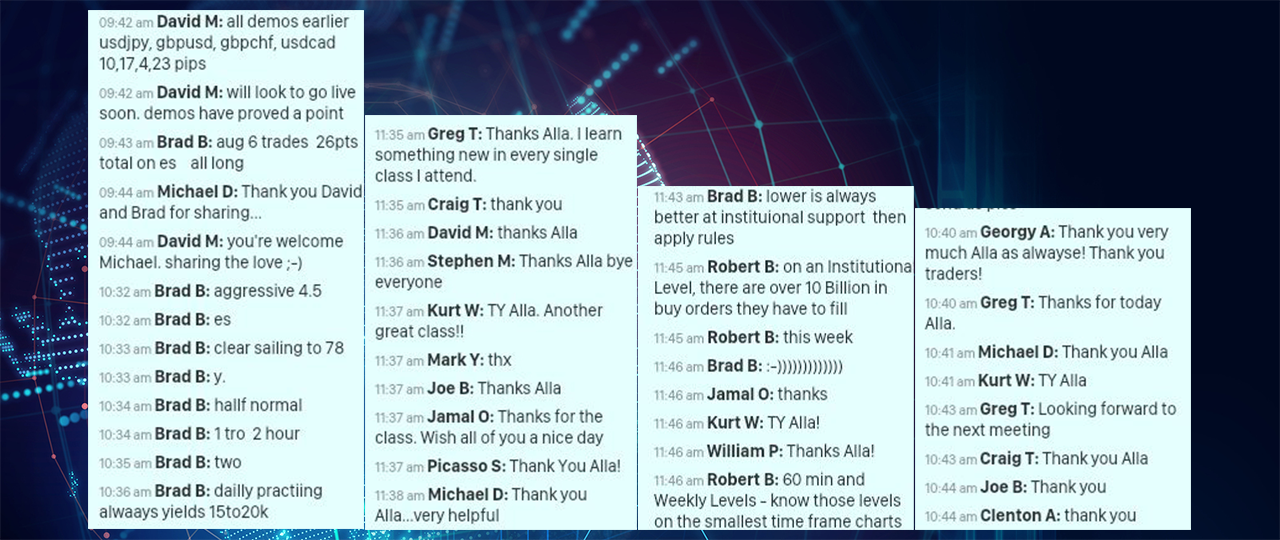
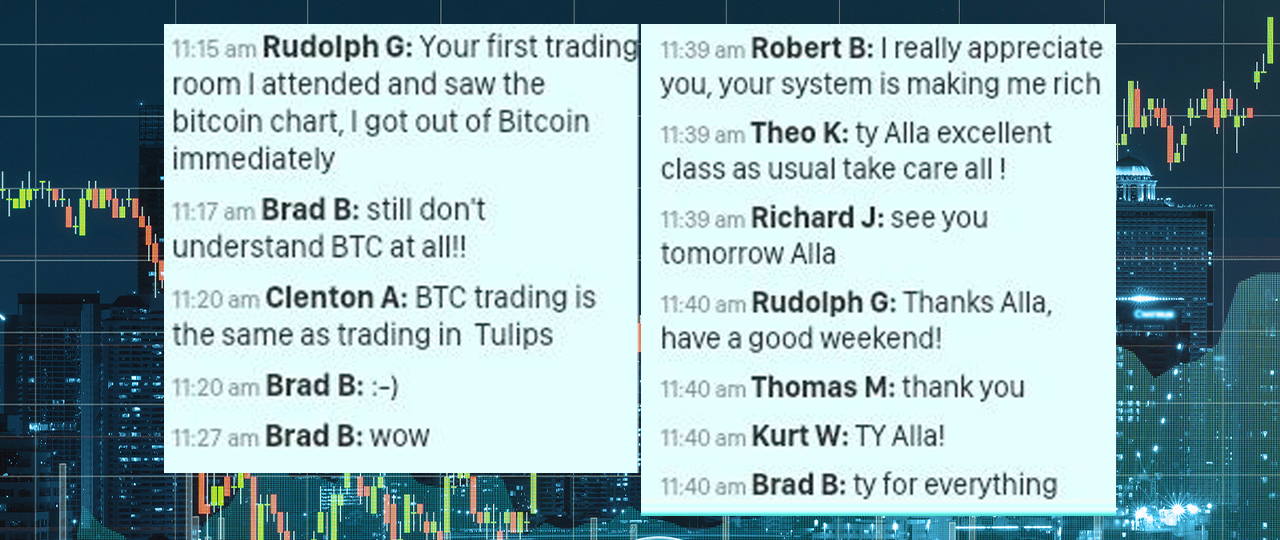
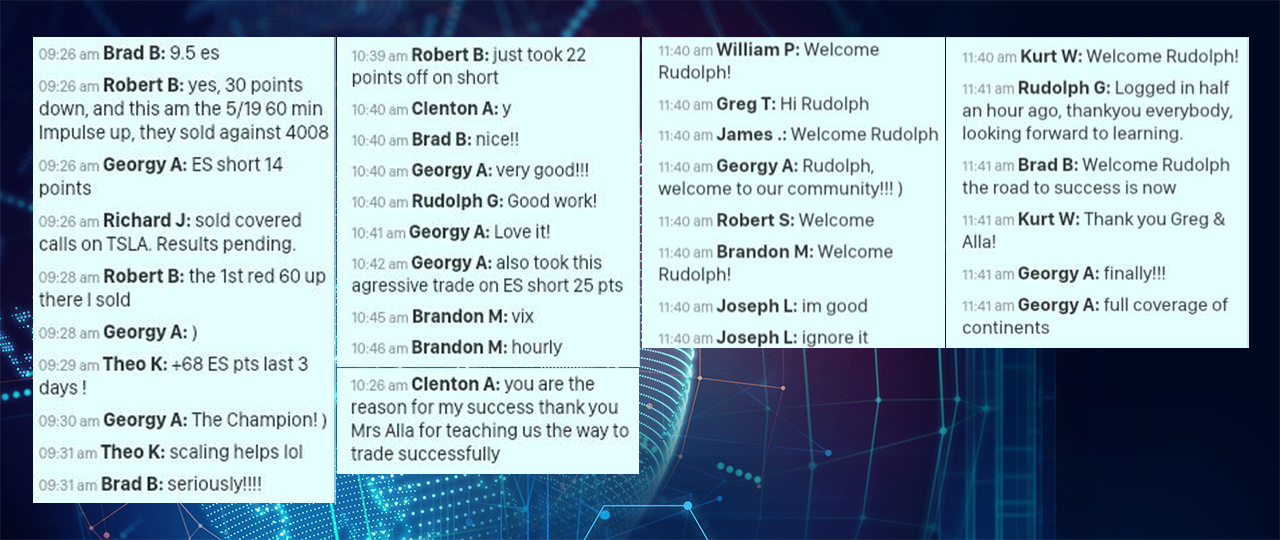
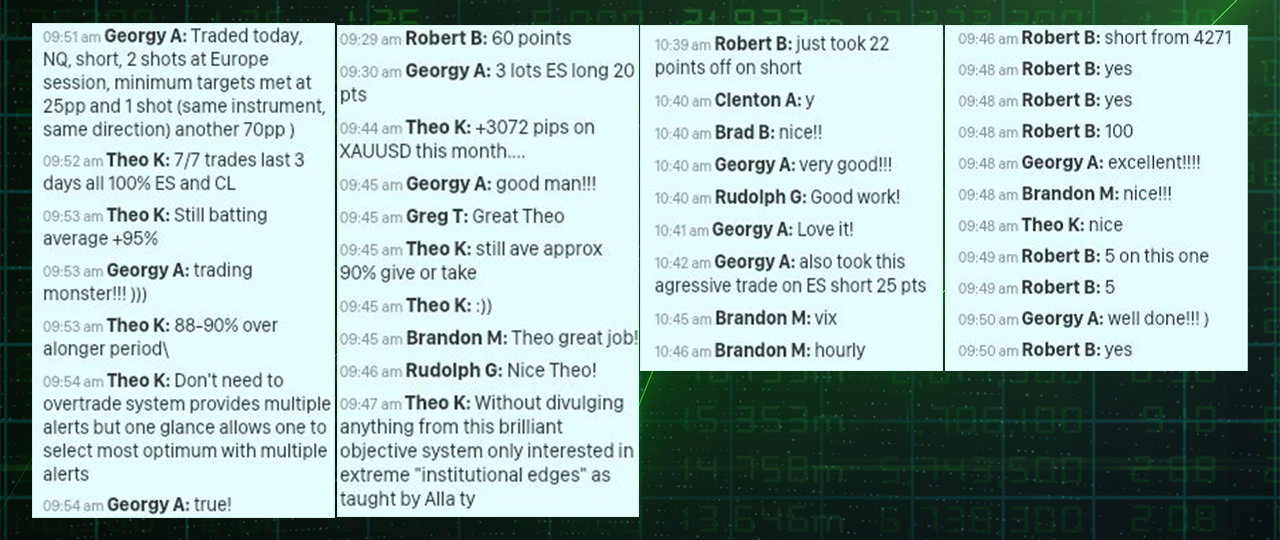
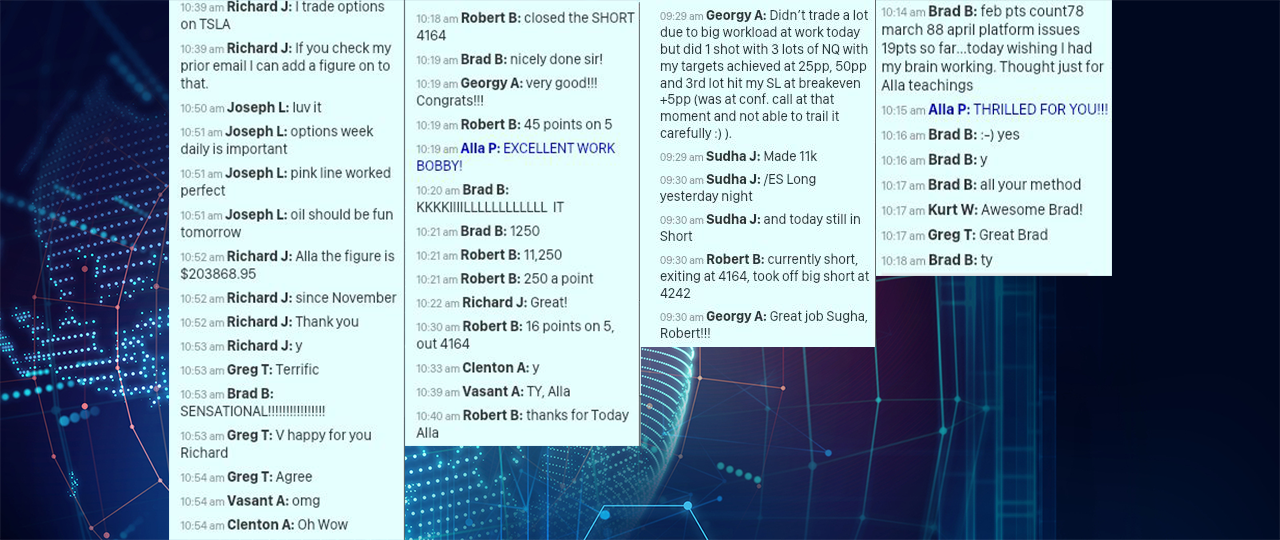
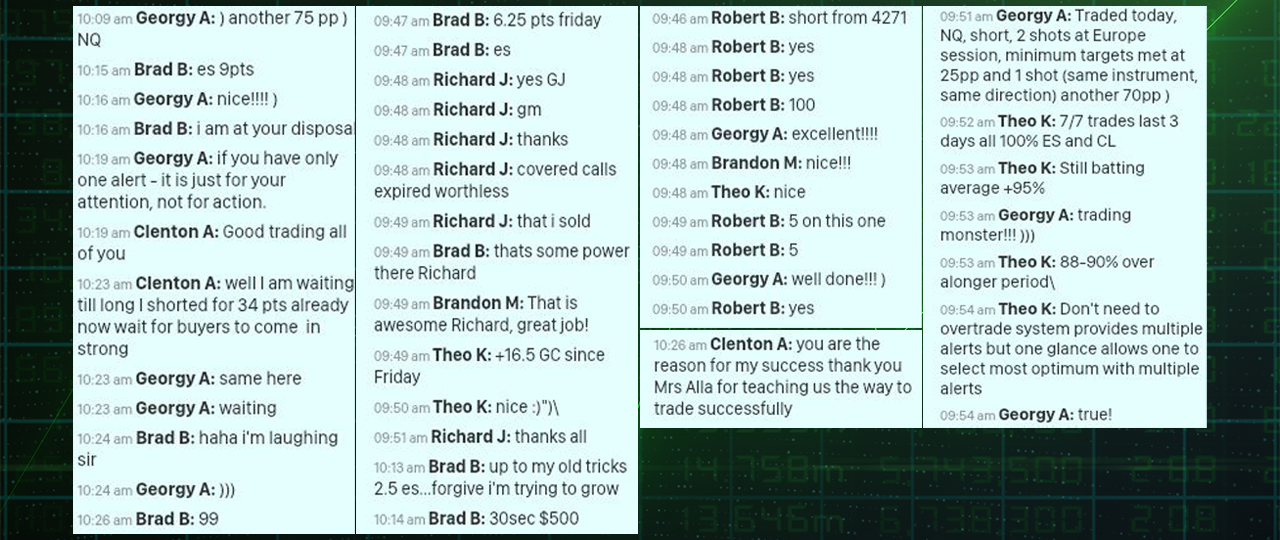
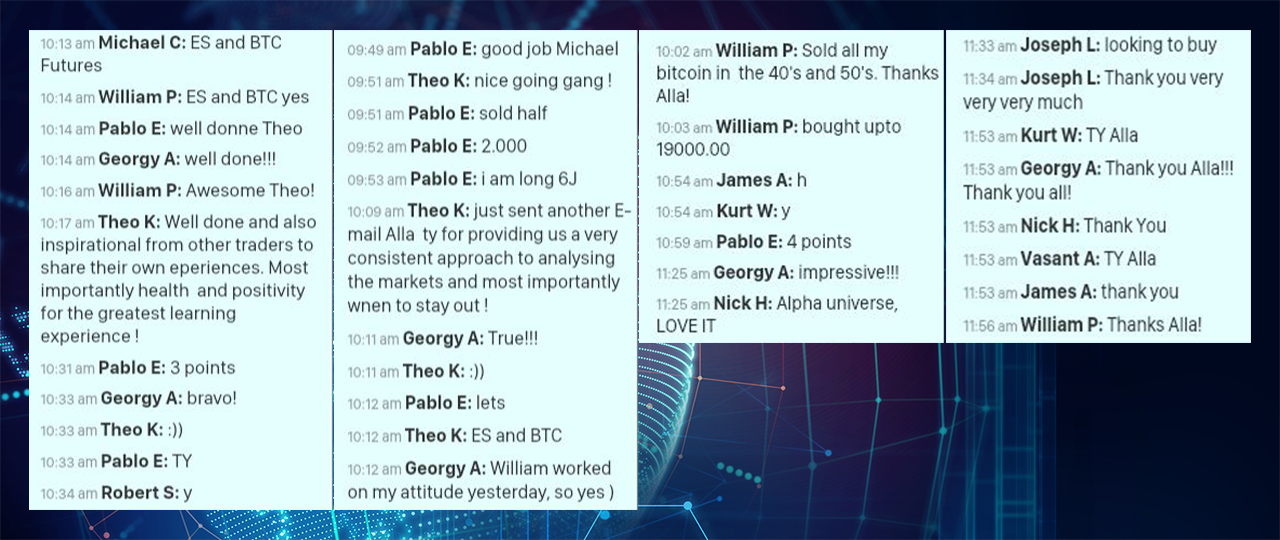
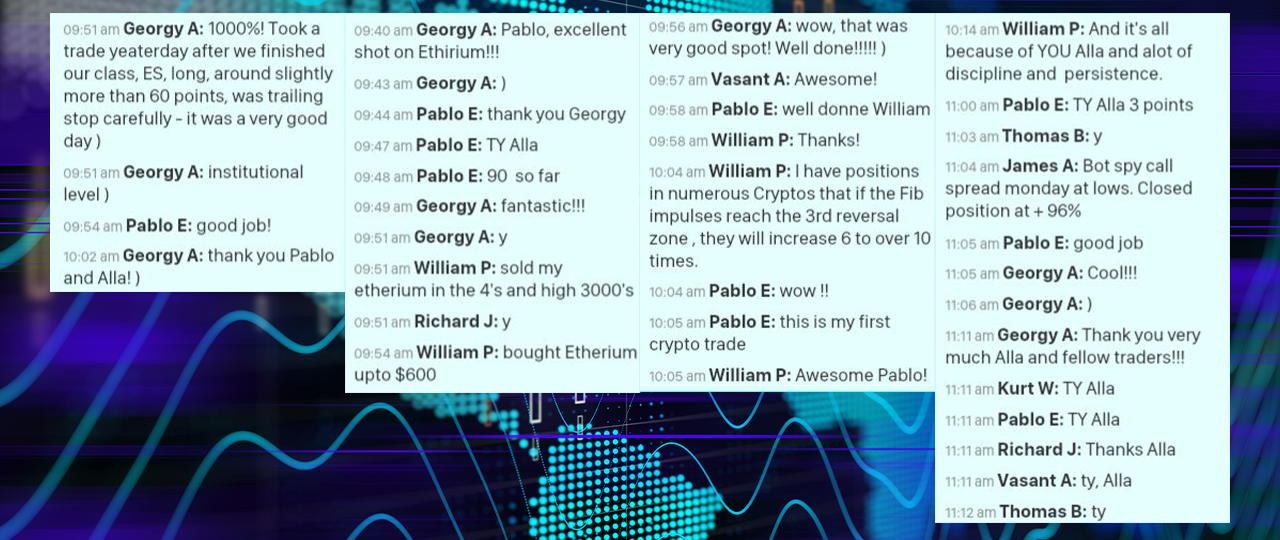
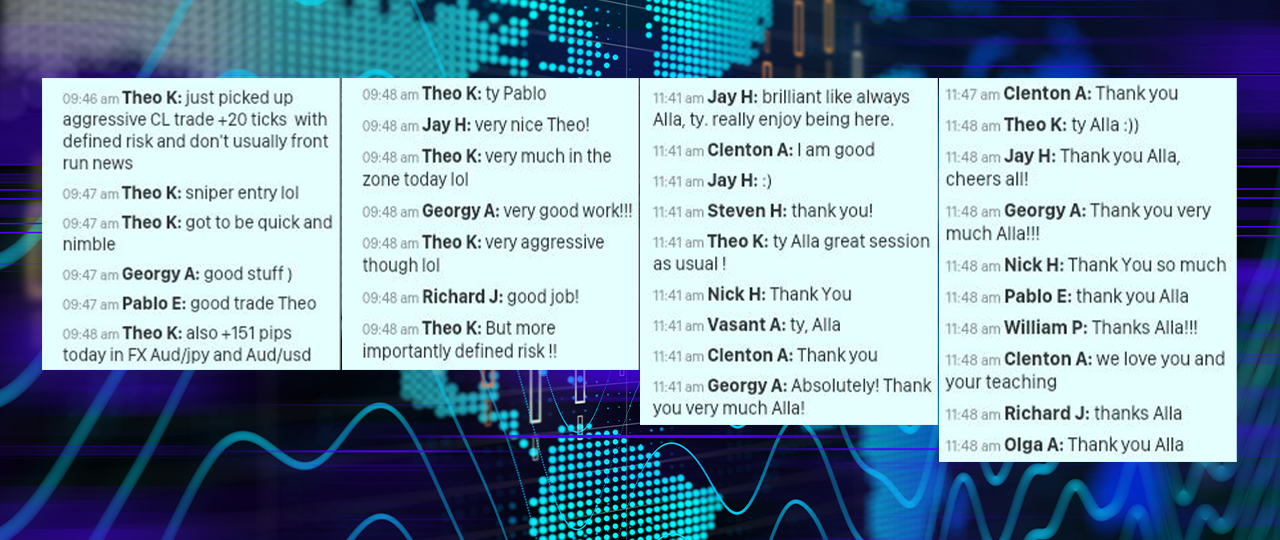
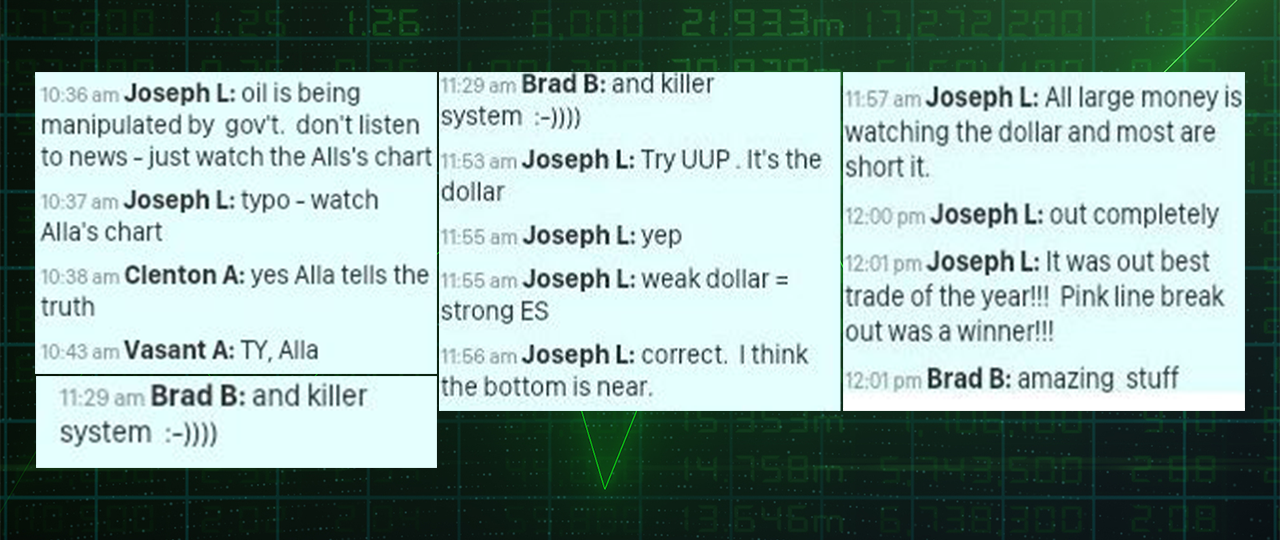
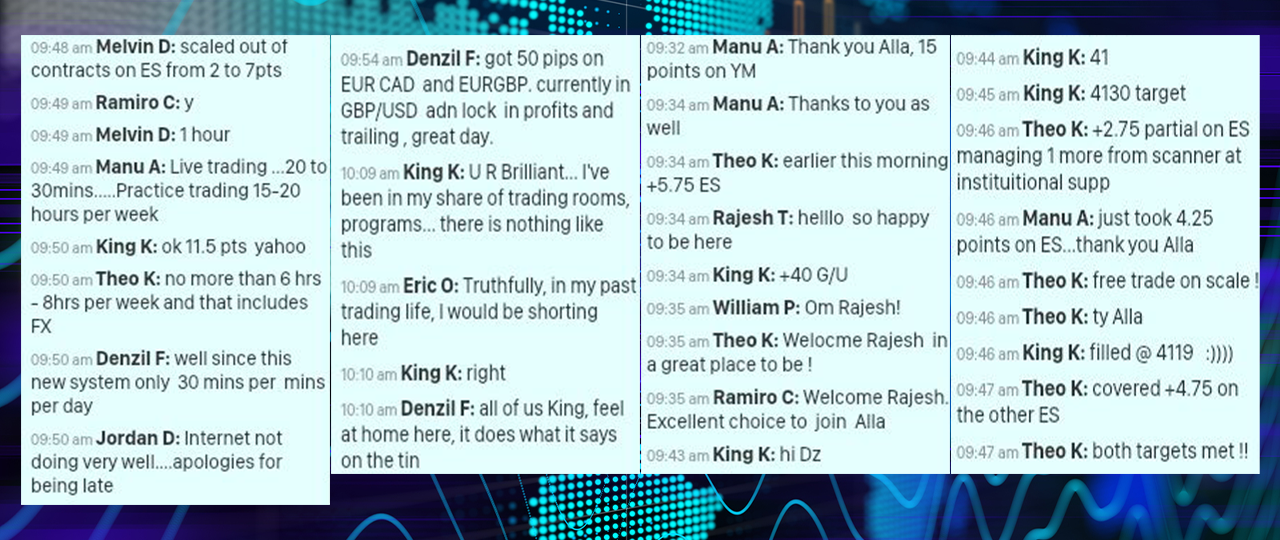
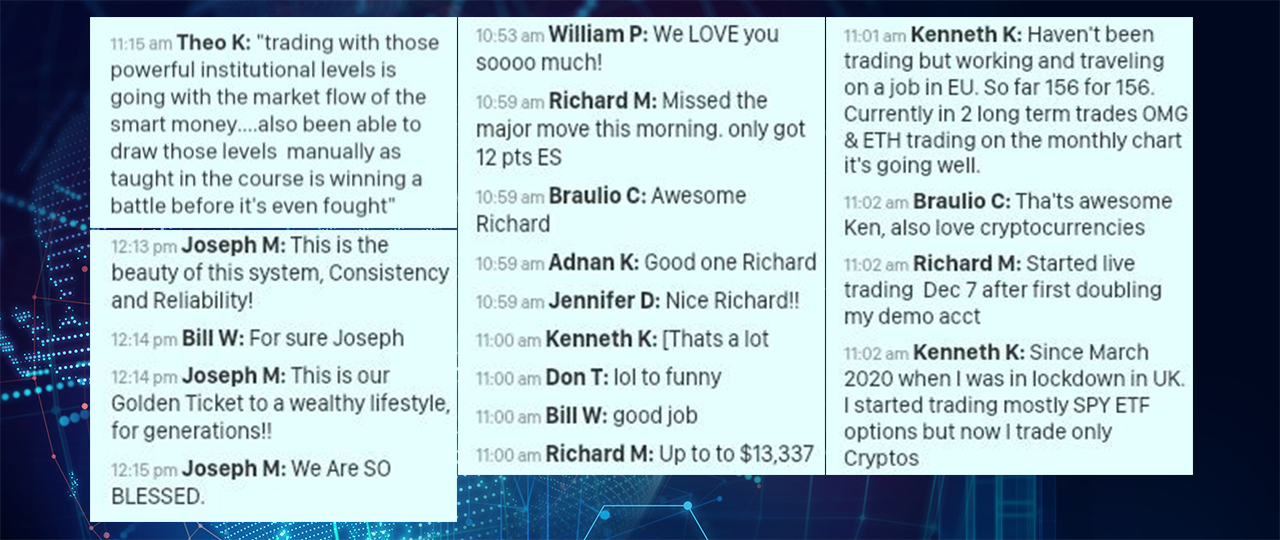
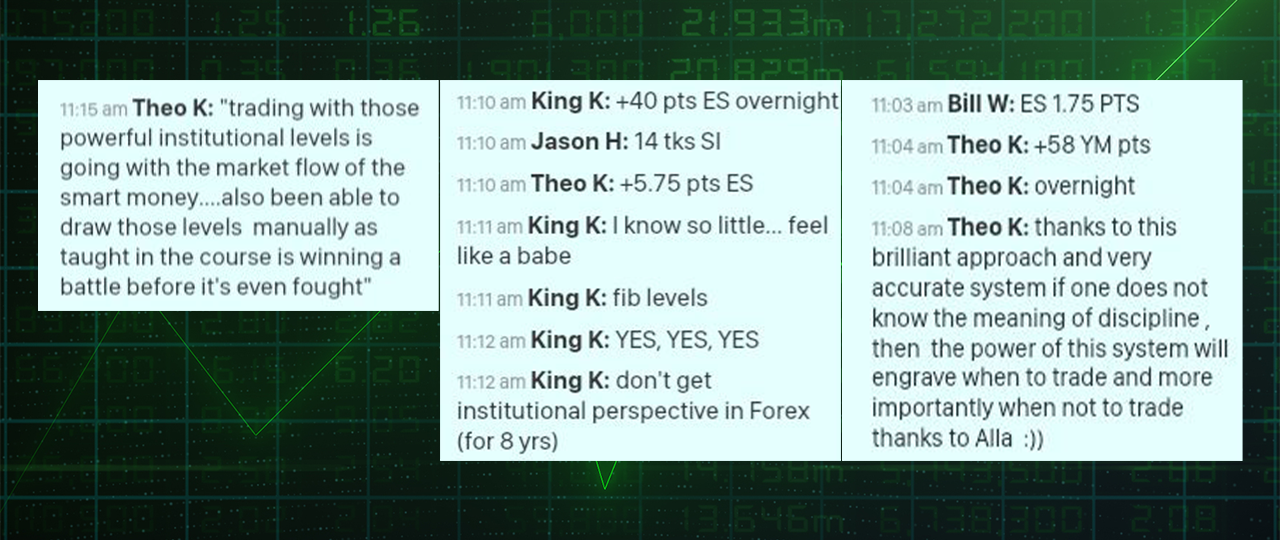
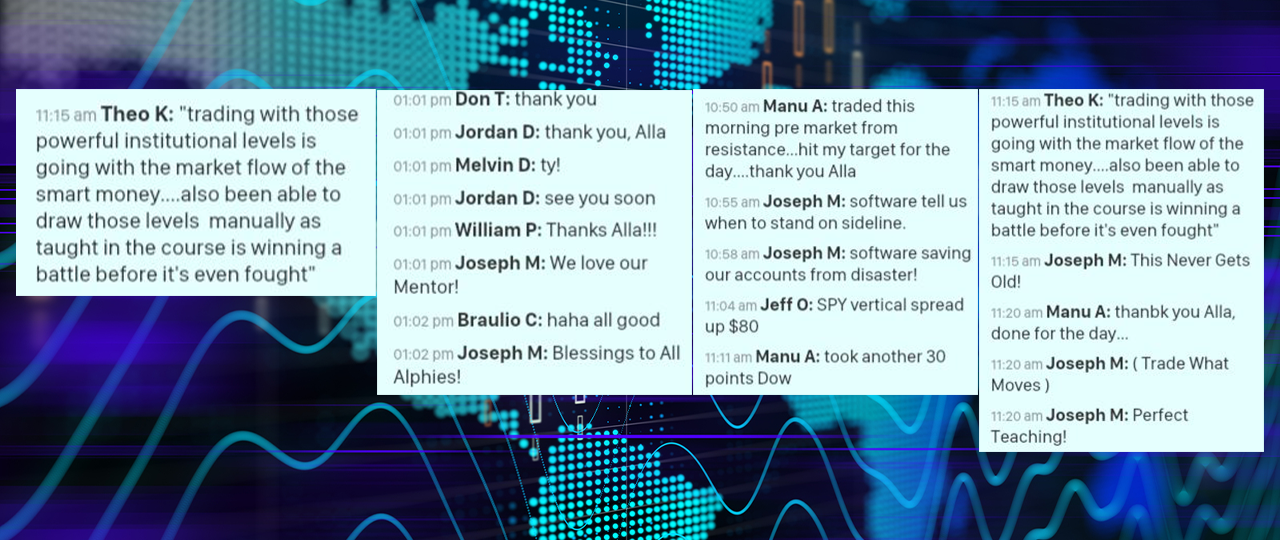
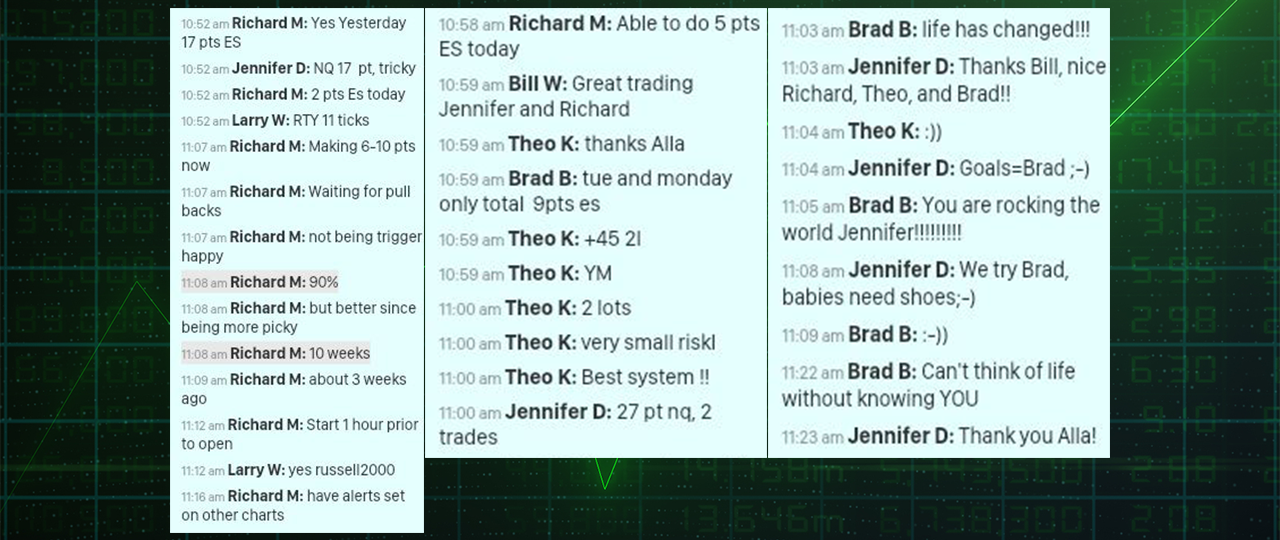
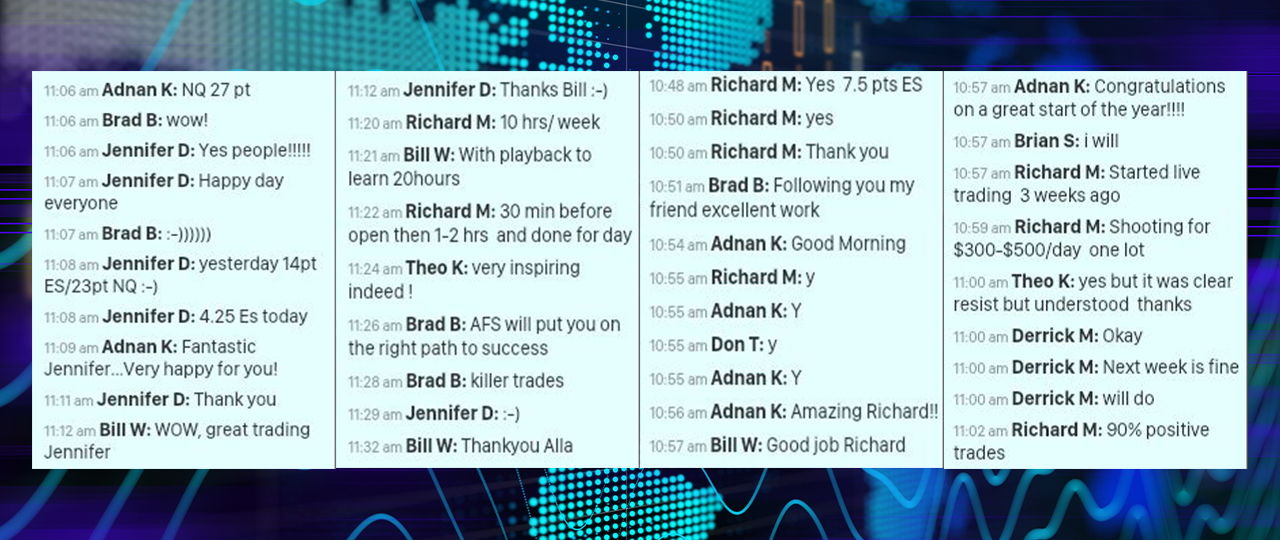
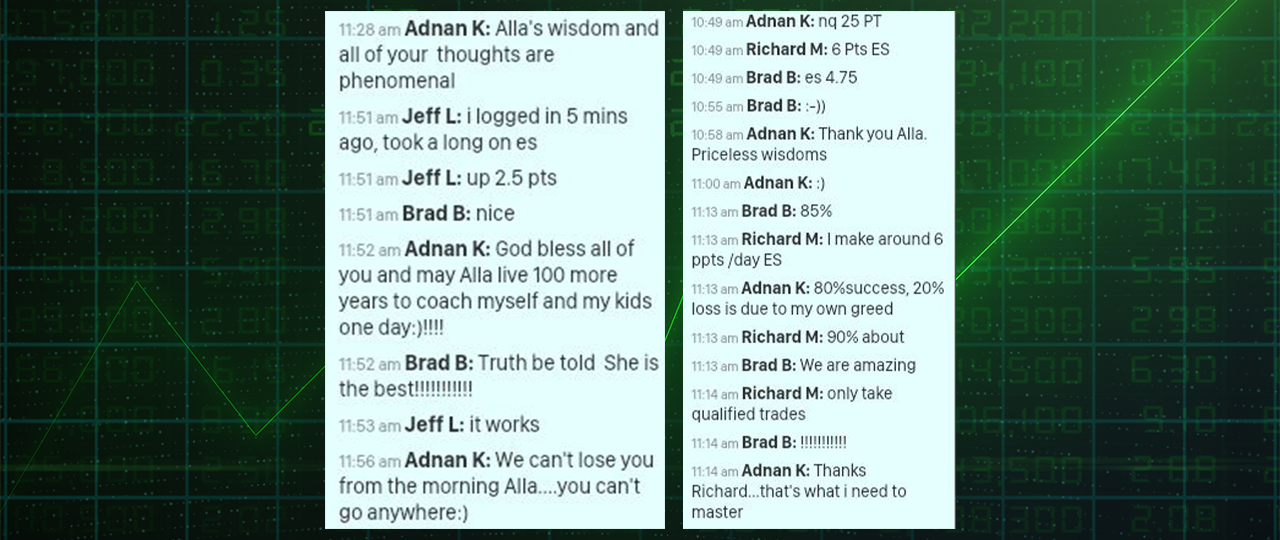
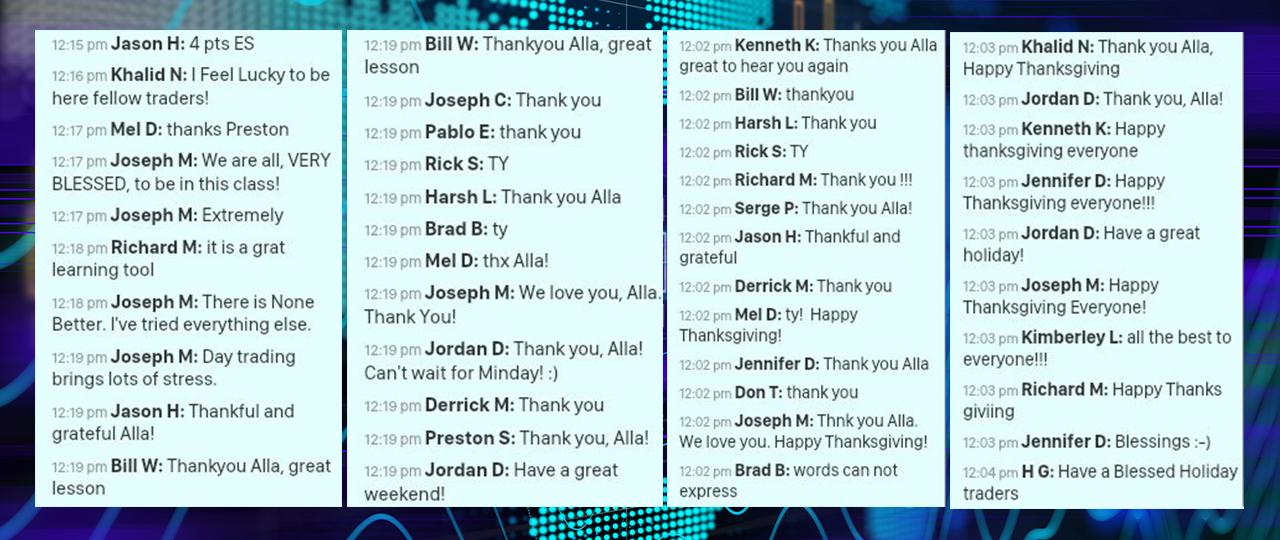
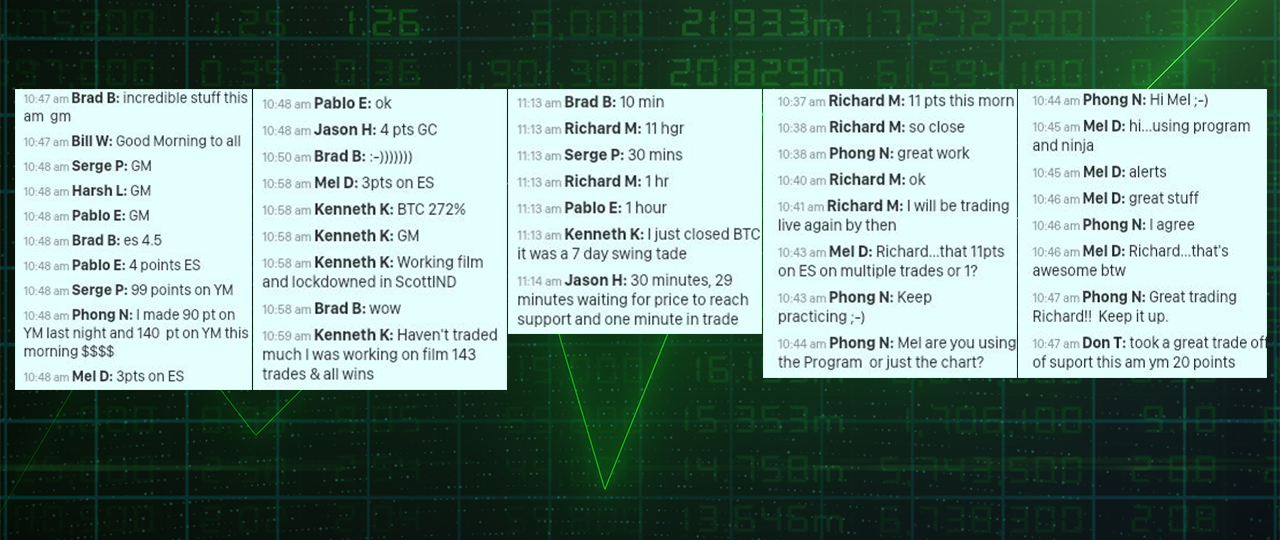
Students share how they trade S&P, Dow, NQ, Oil Futures, Stocks, Crypto, Options and Forex.
(Click on images to enlarge)
TESTIMONIAL DISCLAIMER
Testimonials may not be representative of other clients and is not a guarantee of future performance. All testimonials from students and graduates of the course are believed to be true based on representations of the persons providing the testimonials, but facts stated in testimonials have not been independently audited or verified. Nor has there been any attempt to determine whether any testimonials are representative of the experiences of all persons using the methods described herein or to compare the experiences of the persons giving the testimonials after the testimonials were given. The average reader should not necessarily expect the same or similar results. No person was compensated for providing a testimonial. Fibonacci Trading Institute RESERVES THE RIGHT TO REFUSE SERVICE TO ANYONE AT ANY TIME.
CFTC REQUIRED RISK DISCLOSURE STATEMENT
Fibonacci Trading Institute and its educators are not investment advisors and are not registered with the U.S. Securities and Exchange Commission or the Financial Industry Regulatory Authority. Further, owners, employees, agents or representatives of Fibonacci Trading Institute are not acting as investment advisors and might not be registered with the U.S. Securities and Exchange Commission or the Financial Industry Regulatory. The Fibonacci Trading Institute educational training program and software service are provided to improve financial understanding. The information presented in this site is not intended to be used as the sole basis of any investment decisions, nor should it be construed as advice designed to meet the investment needs of any particular investor. Nothing in our research constitutes legal, accounting or tax advice or individually tailored investment advice.
Hypothetical performance results have many inherent limitations, some of which are described below. No representation is being made that any account will or is likely to achieve profits or losses similar to those shown. In fact, there are frequently sharp differences between hypothetical performance results and the actual results subsequently achieved by any particular trading program.
One of the limitations of hypothetical performance results is that they are generally prepared with the benefit of hindsight. In addition, hypothetical trading does not involve financial risk, and no hypothetical trading record can completely account for the impact of financial risk in actual trading. For example, the ability to withstand losses or to adhere to a particular trading program in spite of trading losses are material points which can also adversely affect actual trading results. There are numerous other factors related to the markets in general or to the implementation of any specific trading program which cannot be fully accounted for in the preparation of hypothetical performance results and all of which can adversely affect actual trading results.
Past performance is not indicative of future results. Futures, options of futures, stocks, forex, and options involve substantial risk and are not suitable for all investors. Our students’ past and current performance does not guarantee anyone else’s current or future performance or results.
FOR FULL RISK DISCLOSURE, DISCLAIMER, AND USER AGREEMENT CLICK HERE
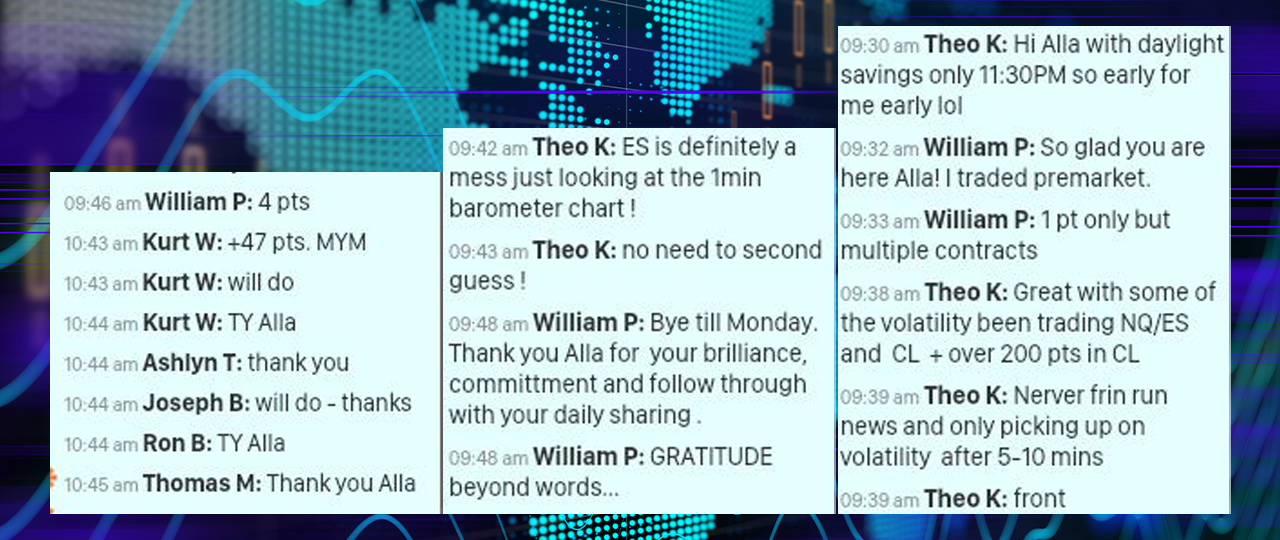
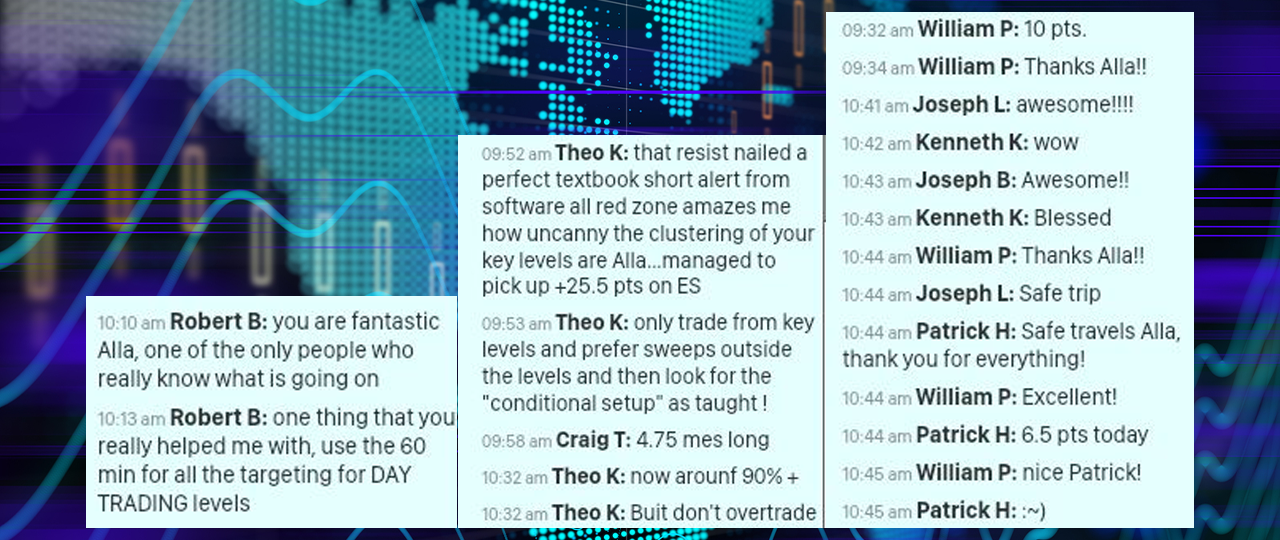
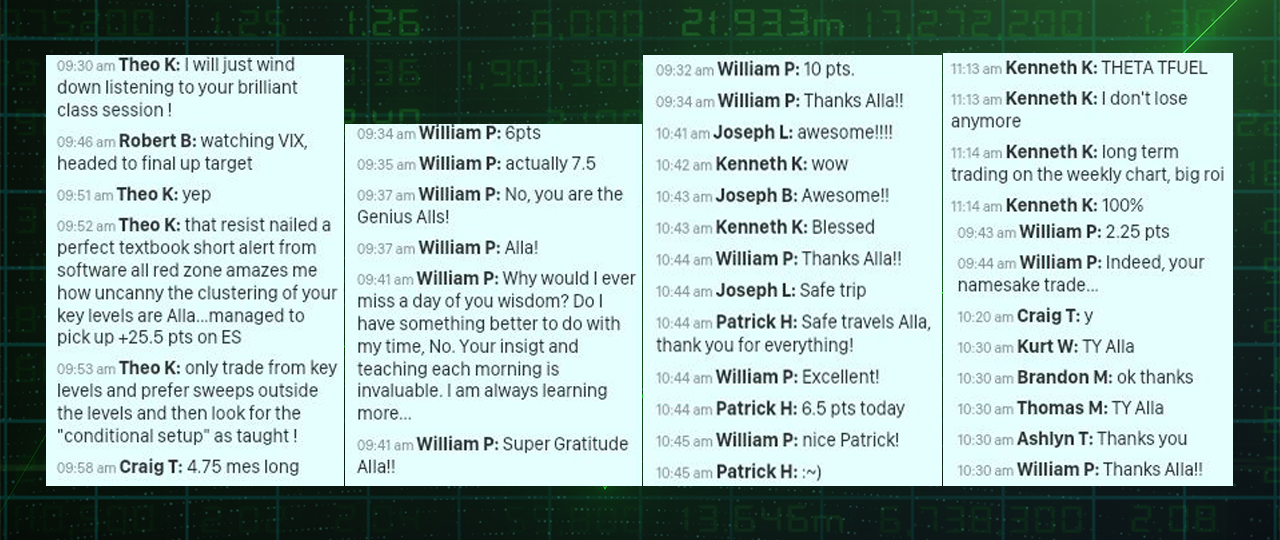
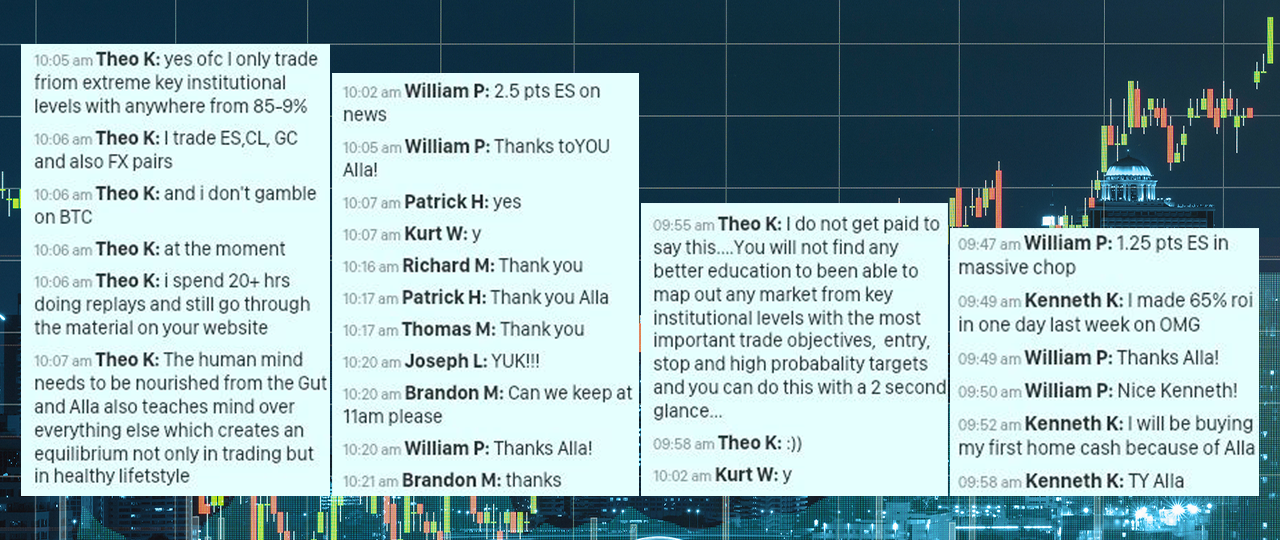
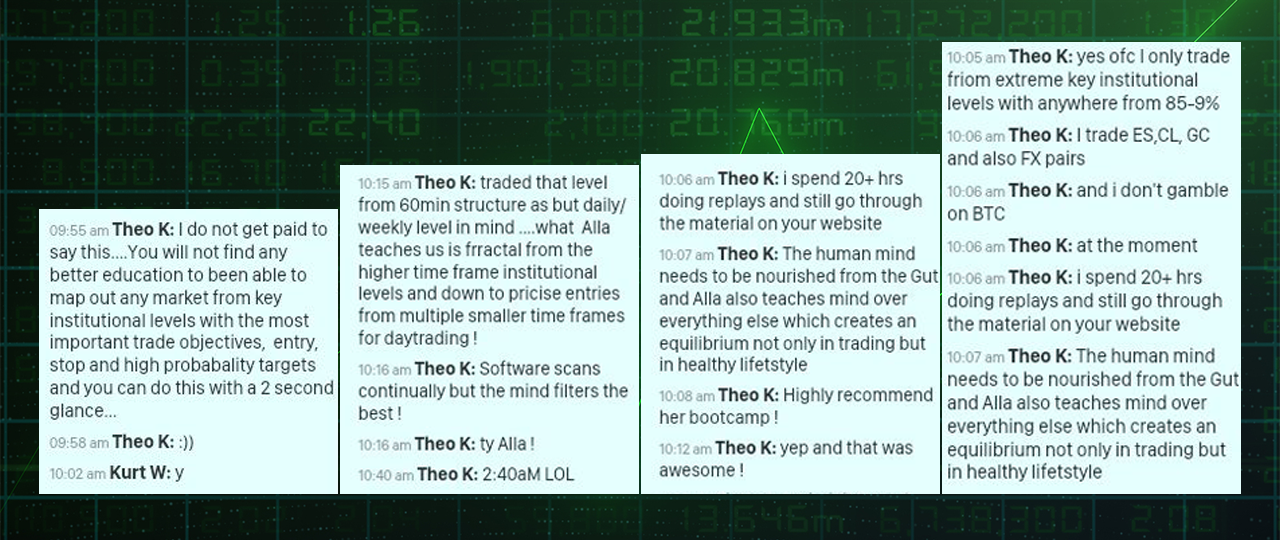
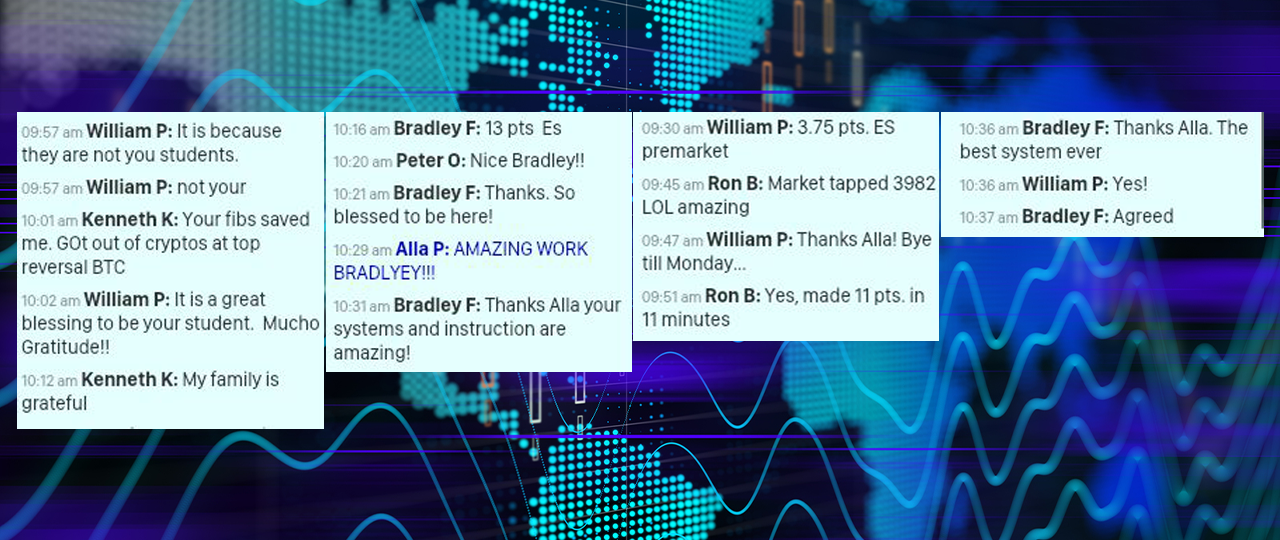
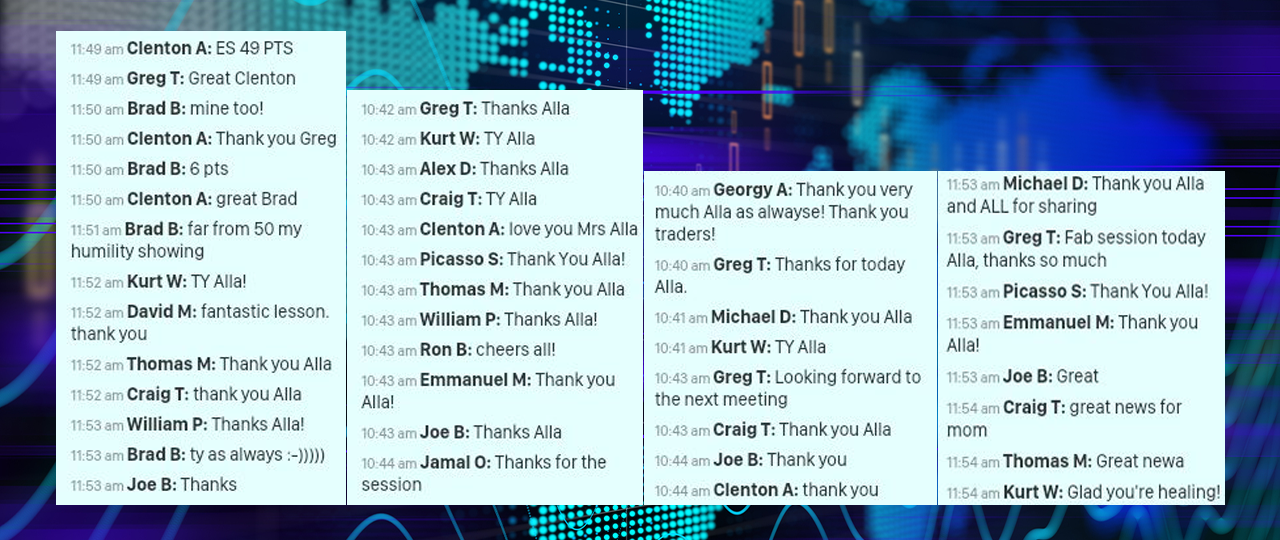
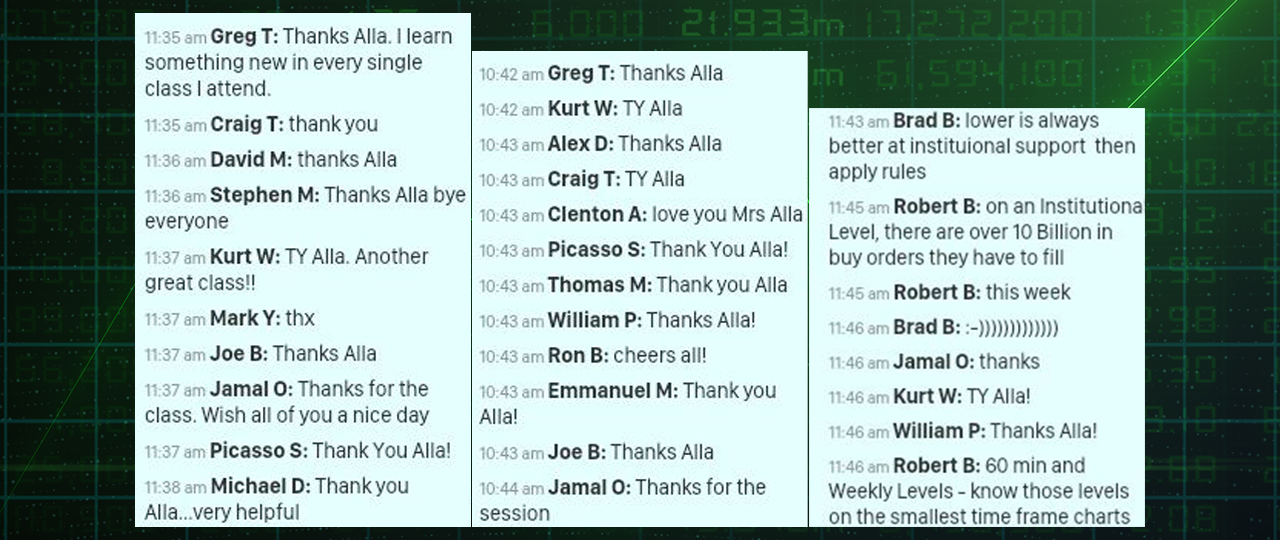
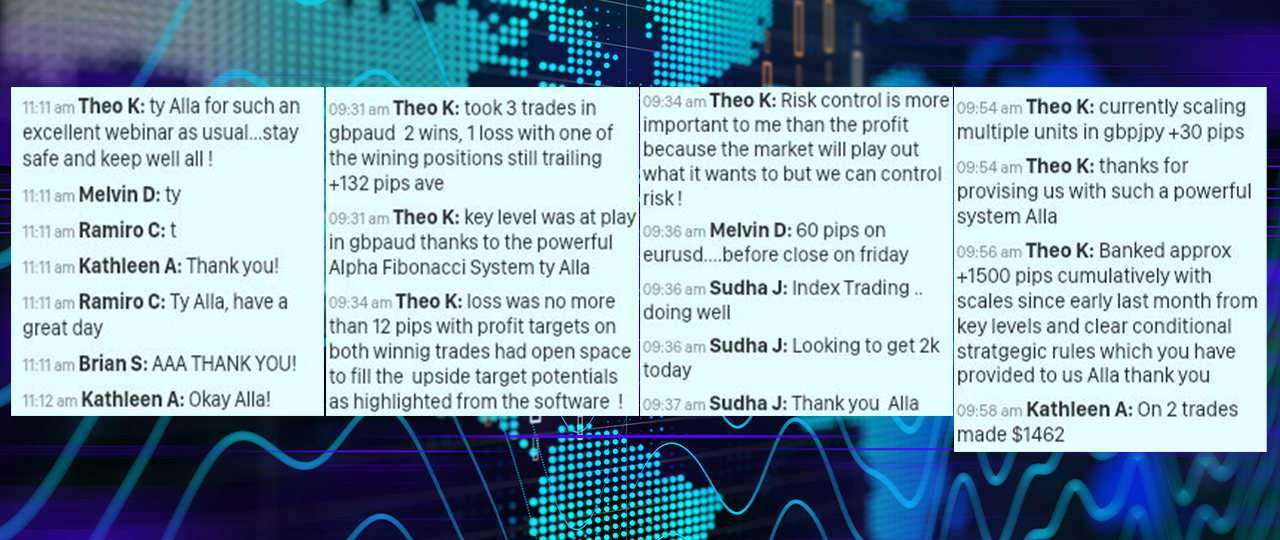
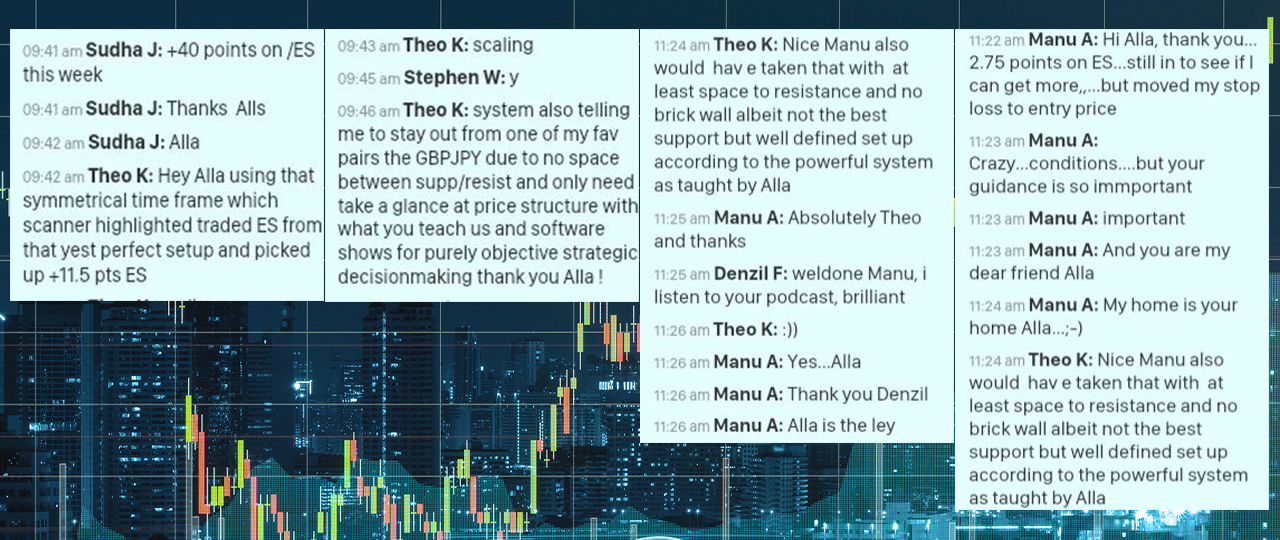
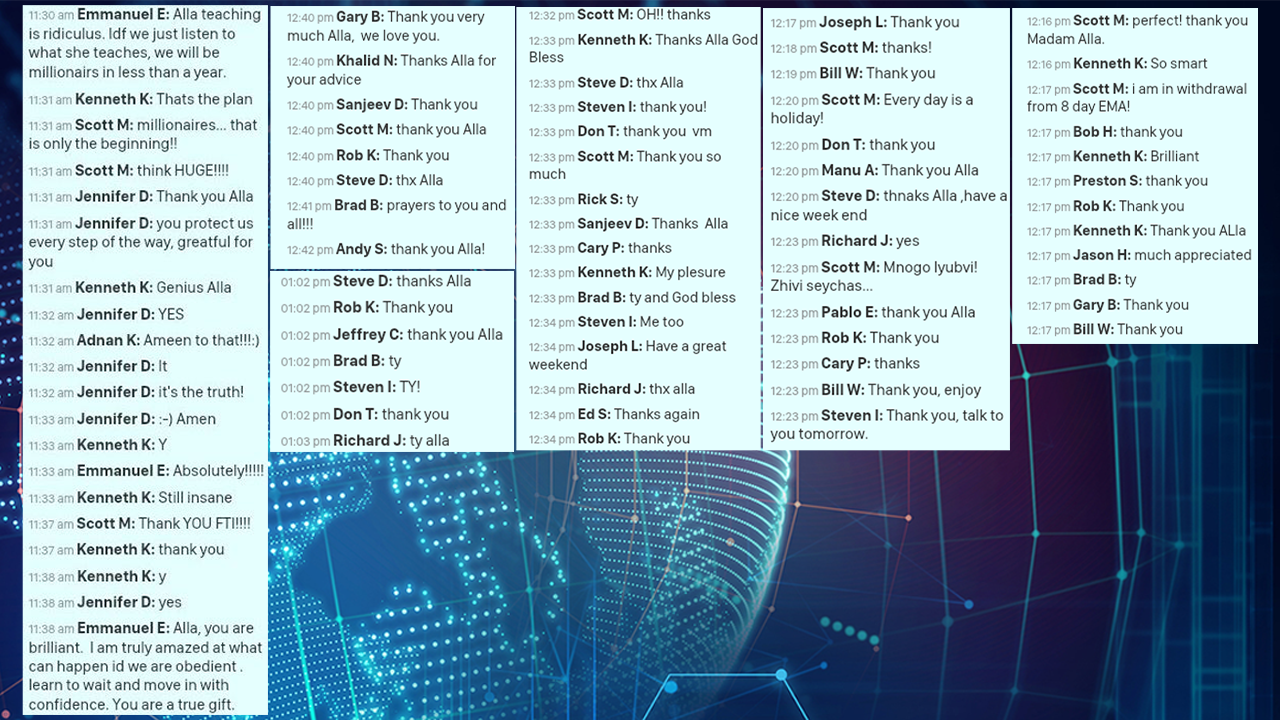
WHAT OUR CLIENTS SAY
“I’m grateful for any profit I make in these wild markets. I will always be grateful to you for sharing this method with us. Love and Light, Ed”
“Simply the best”!!!! Their is no truer statement I can make concerning Alla and what she shows us on a daily basis. Thank you so very much for sharing your gifts and giving us the opportunity to learn and be successful.”
“You can see what has happened to a small US account I have and in particular how my trading has improved since I made the switch to Fibonacci. have a great day and a very big Thank You”